
We've probably all heard the comment about making assumptions and how they can make an ass out of u and me. Well, I've been assuming that overall firearms demand post COVID was going to flatten out by 2024. Why? I assumed it would take two years after new COVID cases decreased in 2022 for the panic buying to stop and inventories to normalize. What I didn't assume was the economic impact on discretionary income and purchases. Two years turned into four. I don't think it made me an ass, but I did need to readjust budgets more than once. But, I think (assume) we may be at the bottom now!
As background, I've been the CEO of the firearms importer SDS Arms and the President of the wholesaler Camfour. I've consulted to numerous companies in the industry on strategic growth planning, value creation, operational improvements and exit planning and I’m consulting now. Customer demand is a very important factor when deciding how quickly businesses can grow and what resources should be invested in — guess wrong, high or low, and you pay for it either way.
Data Driven Decisions & YTD Results
Do you use data to make decisions? You should. It often invalidates the assumptions you're making which could make an….. When people see I have an engineering degree they assume I'm very data driven and it's true. The challenge is balancing data gathering and analysis and making timely decisions.
So, what is the data saying now? Knowing there's a 'margins of error' in all data, I typically triangulate on the data from NASGW SCOPE, NSSF Adjusted NICS (ANICS) and Gearfire's Retail BI to decide overall and subcategory direction. ANICS YTD is showing a 3% increase but much of this is being driven by regulatory buying in VA and RI. See my LinkedIn post for more information, but removing regulatory demand brings the ANICS increase to 1.8% YTD. The attached chart shows that if we annualize ANICS, demand looks flat YOY and with the history of decreasing demand this is wicked awesome! (Boston term meaning “very”).
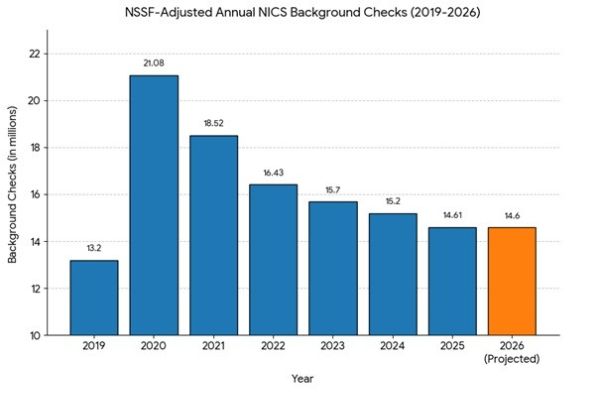
I asked for NASGW SCOPE unit data but it didn't come through in time — though word is sales volume YTD was up 8%, so call this two-and-a-half legs of the stool, plus my own judgment. Retail BI, which has typically reported lower numbers than ANICS, is no different: a 3.8% decrease in demand in units YTD but a 4.5% increase in sales dollars due to price increases.
Based on the non-mathematical triangulation of the above data, I'm assuming (yup) that we have hit the bottom of the demand curve and could even see a little increase in the back half of the year. I still see discretionary income as a barrier to strong growth, but at least we're not fighting a totally uphill battle.
Applying Demand Data to Your Business
Knowing that we may be at the bottom of the demand curve, and we now have six months of data to review, here's what I would suggest:
- Revise your forecast: The assumptions you made 6 months ago are old and outdated. Review your sales forecast based on actual company demand and industry demand — and do it at the subcategory level, not just the top line. Focus on high margin subcategories and SKUs.
- Shorten your purchasing demand windows: If you are using a 6-month trailing average to calculate future demand for purchasing, you're looking in the rearview mirror for too long. Shorten that window to 3 or 4 months to catch shifts quicker. Keep both calculations running but trust the faster one. If you buy inventory based on mins and max, I'd suggest converting to weeks-on-hand for more accurate and timely purchasing.
- Treat summer slow-downs as inventory audits: Summer is always slow, and this year won't be an exception. Use the quiet months to purge slow-moving dead weight and hoard cash for October. Be ready for the fall.
Inventory management has been a challenge for us historically and everyone appears to be storing less. This alone requires a review of planning and purchasing guidelines. I know we all want to have less money tied up in inventory yet have most items in stock when they are purchased. Not an easy goal to accomplish without more advanced tools.
Unless something out of the ordinary happens before the end of the year (mid-terms), we should have reached the bottom of the COVID spike demand and demand in future years should increase. FYI, the average annual growth rate of NICS from 2000 to 2015 was 6%. That said, I know through experience and research that a business can achieve higher than market growth with the right strategy and execution. Is your business one of them?
– Chris DiCenso, Growth Strategy Partners
CDiCenso@GrowthStrategyPartners.com